How to Read Forex Charts for Beginners: The Truth Your Broker Won't Post
How to read forex charts for beginners without losing your first $50. Learn candlesticks, timeframes, and the Naira funding traps to avoid.
If you typed how to read forex charts for beginners into Google, you probably got ten videos and a course popup before you got a straight answer. Here's the honest part nobody leads with: reading a chart isn't hard. Believing what a rented-Lekki guru tells you about it is what's hard.
Most beginners in Lagos, Abuja, and Accra blow their first $50 (about ₦75,000) not because charts are complicated, but because they were sold a story. The story says a secret indicator exists, and once you buy it, the market pays you. It doesn't work like that. Charts are just a record of what buyers and sellers already did. Your job is to read that record, not to predict the future.
So here's what you'll walk away with. You'll understand candlesticks, timeframes, support and resistance, and the one free tool that replaces every paid indicator you've been pitched. And you'll know exactly when to close the laptop and keep your money.
Why Your First Chart Looks Like Static (And What's Really Happening)
Open any pair, say EUR/USD, and you'll see a wall of red and green bars moving up and down. It feels like noise. That feeling is normal, and it's the exact moment most people quit or, worse, pay someone to interpret it for them.
Here's what's actually on screen. Each bar represents a fixed slice of time. Each one shows four numbers: where price opened, where it closed, the highest point it touched, and the lowest. That's it. When you know how to read forex charts for beginners properly, you're really just learning to read those four numbers in context.
The context matters more than the shape. A green candle on a quiet Monday in Asia means almost nothing. The same green candle right after a US inflation release means a lot. Volume, timing, and the news calendar give the bars meaning. Without that context, you're staring at static.
One thing you only notice after months of screen time: markets spend most of their life doing nothing. Roughly 70% of the time, price chops sideways in a range. Beginners lose money because they treat every candle like a signal. Experienced traders treat most candles as background noise and wait for the few that matter.
Candlesticks: The Only Four Prices That Matter
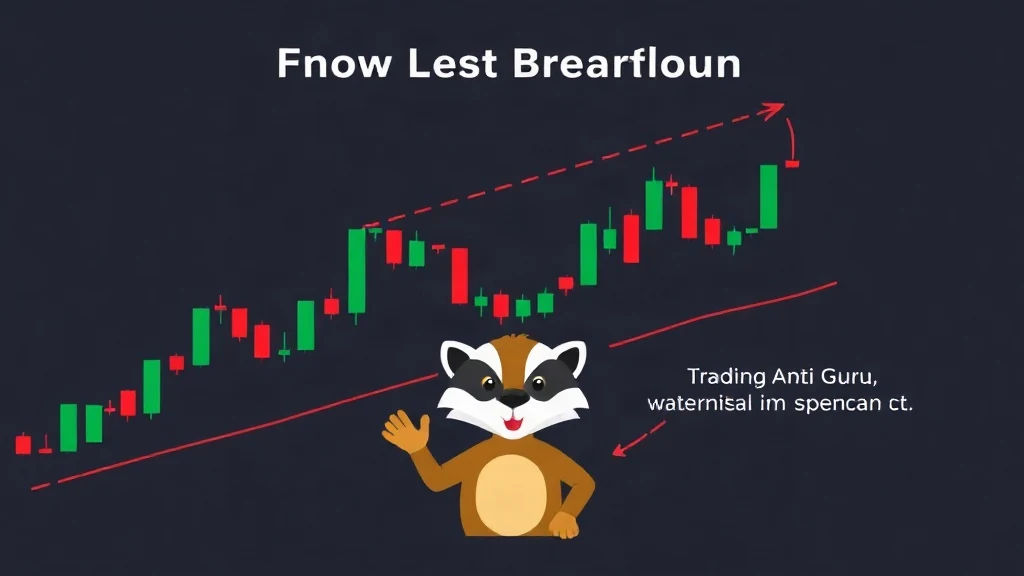
A candlestick is a bar with a body and thin lines called wicks. The body shows the open and close. The wicks show the high and low. That's the whole thing.
When the close sits above the open, the candle is usually green or white. When the close sits below the open, it's red or black. A long body means strong movement in one direction. A tiny body with long wicks on both sides means the market fought hard and nobody won.
Here's the number that matters most: the close. Amateurs obsess over the high and low. Professionals care about where price finished, because the close is the only price both sides agreed on. If a candle closes back below a level it just broke, that break was fake. That's called a false breakout, and it traps more beginners than any other pattern.
Timeframes: One Chart, Four Different Stories
This is where how to read forex charts for beginners starts to click. The same chart looks completely different depending on your timeframe.
A daily candle takes 24 hours to form. A 15-minute candle takes 15 minutes. So a "huge" move on the 15-minute chart might be a tiny blip on the daily. Same market, different zoom level.
Beginners love the 1-minute chart because it feels exciting. It's also the fastest way to lose money through spread and fees. The spread on EUR/USD might be 1 pip, and if you're scalping 1-minute candles, you're paying that cost dozens of times a day. Over a month, that's not trading, that's donating.
The practical rule: pick one higher timeframe to find your direction, and one lower timeframe to time your entry. Daily for bias, 4-hour for the setup, 1-hour for entry. No more than that. Legendary trader Jesse Livermore made his fortune reading price action, not by staring at tick charts, and his story is worth reading on [Wikipedia](https://en.wikipedia.org/wiki/Jesse_Livermore) if you want proof that patience beats speed.
Support, Resistance, and the Zones That Actually Hold
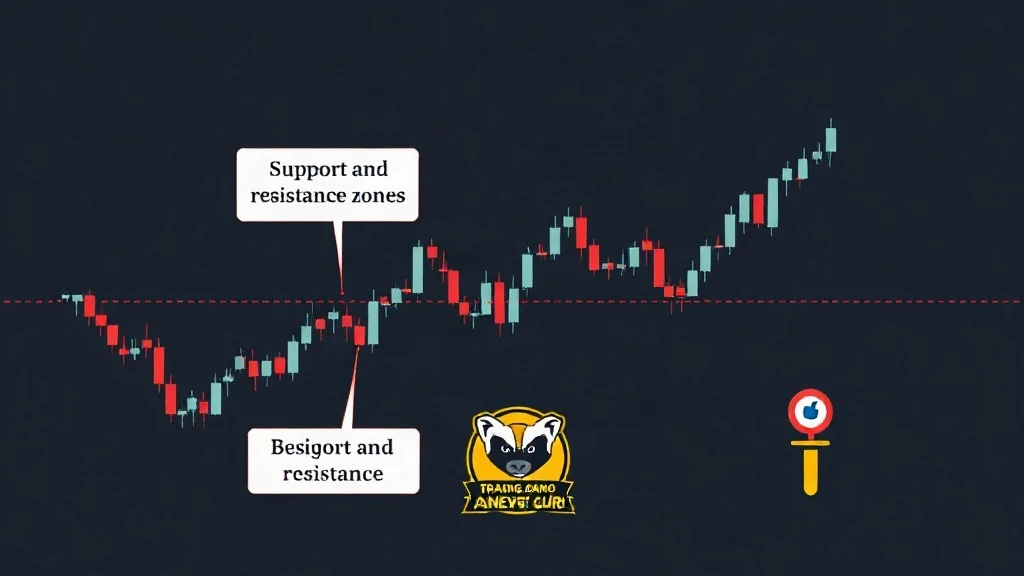
Support is a price area where buyers have stepped in before. Resistance is where sellers have shown up. Draw them as zones, not thin lines, because markets aren't precise.
Here's a real example. In September 2022, GBP/USD crashed to a low near 1.0350 after the UK mini-budget chaos. That level became a hard floor. Price bounced off it for weeks before recovering. A trader who marked that zone in advance had a plan. A trader who didn't was just reacting to headlines.
Specific thresholds worth remembering: if a level has been tested three or more times and held, treat it as significant. If price closes more than 20 pips beyond a level and stays there for a full candle, the level likely broke. And if you're risking more than 1% of your account per trade, you're not reading charts, you're gambling.
What the Guru Won't Tell You About Indicators
Every paid course sells indicators. RSI, MACD, Bollinger Bands, and a hundred others. Here's the uncomfortable truth: indicators are math done on past prices. They don't see the future. They just repackage what the candles already told you, usually with a delay.
Stacking five indicators on one chart doesn't give you five edges. It gives you five versions of the same information, plus analysis paralysis. The guru knows this. He also knows that a "system" feels more valuable when it looks complicated.
The one free tool that fixes this is TradingView. Open a free account, search "EURUSD" in the top left, then click the clock icon to switch timeframes. Right-click any candle and select "Object Tree" to inspect exact open, high, low, and close values. Use the horizontal line tool to mark your zones. That's the entire paid-indicator pitch, replaced by a free charting platform.
Correlation matters here too. EUR/USD and GBP/USD usually move together, because both are priced against the US dollar. USD/CHF tends to move opposite to EUR/USD. If you buy EUR/USD and GBP/USD at the same time, you're not diversified, you've just doubled one bet.
How to Practice Reading Forex Charts for Beginners Without Losing Money
You don't need real money to learn how to read forex charts for beginners. You need screen time and a journal.
Open TradingView, scroll back six months on any pair, and hide the right side of the chart so you can't see the future. Then click forward one candle at a time and write down what you think happens next. Do this for 50 candles. You'll learn more in two weeks than most people learn in a year of live trading.
A mindset shift happens around here. Before: "I need to catch every move or I'm missing out." After: "I only need three good setups a month." Before: "This indicator must be broken." After: "My entry was early, the level wasn't ready." That shift is the difference between a trader and a gambler.
Then there's the Nigerian reality. Funding an account isn't like the movies. Local bank cards often get blocked for international broker deposits because of CBN limits on forex transactions. Most people route money through Binance P2P, Bybit P2P, Chipper Cash, or Grey.co. Budget for the spread you lose converting Naira to USD, because that hidden cost eats into every trade before you even start. And with inflation chewing the Naira every year, your trading gains need to beat that erosion, not just a US benchmark.
When to Close the Laptop and Keep Your Money
The best skill in chart reading is knowing when not to trade. Sit out when a major news release is within 30 minutes, because spreads widen and candles turn random. Sit out when you've already lost two trades in a day, because revenge trading is how accounts die. Sit out when you can't clearly explain your setup in one sentence.
Timing has patterns too. The London open, around 8am to 10am GMT, brings the most volume in EUR and GBP pairs. The New York open, 1pm to 3pm GMT, brings USD volatility. The Asian session is usually quiet and range-bound. Trade when liquidity is real, not when you're bored at midnight.
And watch for the local scam layer. WhatsApp and Telegram "account managers" promise to double your $100 (about ₦150,000). They can't. Nobody can guarantee returns. If someone shows you a rented car in Lekki as proof of skill, that's not a track record, that's a marketing budget.
If you can't explain your setup in one sentence, you don't have a setup, you have a hope.
Start with a demo account, one pair, one timeframe, and a notebook. Learn how to read forex charts for beginners the slow, honest way, and you'll still have an account in a year. Chase signals, and you won't.
Disclosure: This article contains affiliate links. If you sign up through our links, tradingantiguru.com may earn a commission at no extra cost to you. We only recommend tools we'd use ourselves.
FAQ
Q: How long does it take to learn how to read forex charts for beginners? A: Learning how to read forex charts for beginners takes most people about four to eight weeks of daily practice. You need screen time, not talent. Spend 30 minutes a day marking candles and levels, and you'll read basic charts faster than any course promises.
Q: What is the best timeframe for a beginner trader? A: The best timeframe for a beginner is the daily chart for direction and the 4-hour or 1-hour for entries. Fast 1-minute charts feel exciting but the spread and fees destroy small accounts. Slower timeframes give you time to think before you click.
Q: Can I learn how to read forex charts for beginners without spending money? A: Yes. Free tools like TradingView give you everything you need to practice how to read forex charts for beginners. Avoid paid signal groups and expensive courses until you've logged at least 100 hours on a demo account and proven you can follow a plan.
About the Author Kareem is the founder of TradingAntiGuru, an honest trading education site built on one rule: never recommend anything not personally used or genuinely believed in. Years of trading experience across forex, stocks, ETFs, and crypto.